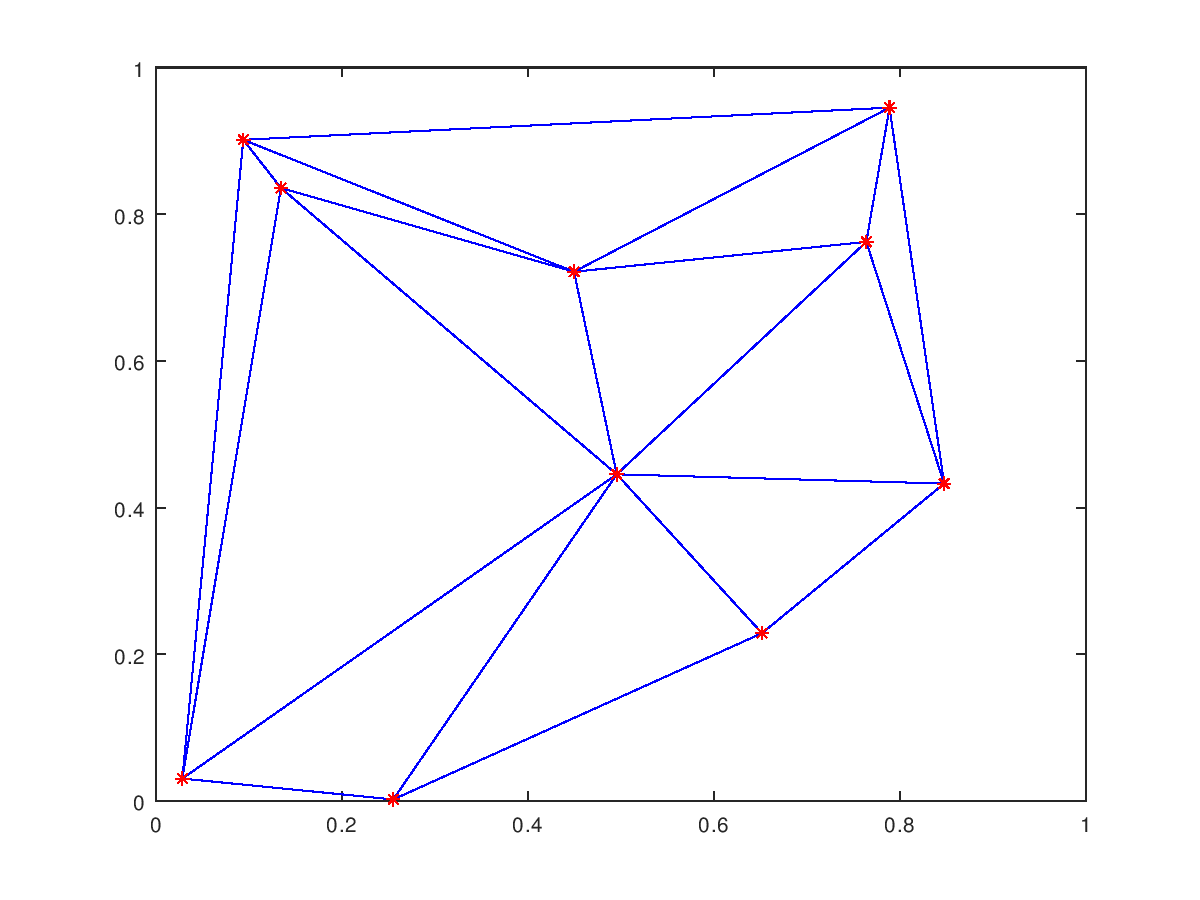
Figure 30.1: Delaunay triangulation of a random set of points
Next: Voronoi Diagrams, Up: Geometry [Contents][Index]
The Delaunay triangulation is constructed from a set of circum-circles. These circum-circles are chosen so that there are at least three of the points in the set to triangulation on the circumference of the circum-circle. None of the points in the set of points falls within any of the circum-circles.
In general there are only three points on the circumference of any circum-circle. However, in some cases, and in particular for the case of a regular grid, 4 or more points can be on a single circum-circle. In this case the Delaunay triangulation is not unique.
Compute the Delaunay triangulation for a 2-D or 3-D set of points.
For 2-D sets, the return value tri is a set of triangles which
satisfies the Delaunay circum-circle criterion, i.e., no data point from
[x, y] is within the circum-circle of the defining triangle.
The set of triangles tri is a matrix of size [n, 3]. Each row defines
a triangle and the three columns are the three vertices of the triangle.
The value of tri(i,j) is an index into x and y for
the location of the j-th vertex of the i-th triangle.
For 3-D sets, the return value tetr is a set of tetrahedrons which
satisfies the Delaunay circum-circle criterion, i.e., no data point from
[x, y, z] is within the circum-circle of the defining
tetrahedron. The set of tetrahedrons is a matrix of size [n, 4]. Each row
defines a tetrahedron and the four columns are the four vertices of the
tetrahedron. The value of tetr(i,j) is an index into x,
y, z for the location of the j-th vertex of the i-th
tetrahedron.
The input x may also be a matrix with two or three columns where the first column contains x-data, the second y-data, and the optional third column contains z-data.
The optional last argument, which must be a string or cell array of strings,
contains options passed to the underlying qhull command.
See the documentation for the Qhull library for details
http://www.qhull.org/html/qh-quick.htm#options.
The default options are {"Qt", "Qbb", "Qc", "Qz"}.
If options is not present or [] then the default arguments are
used. Otherwise, options replaces the default argument list.
To append user options to the defaults it is necessary to repeat the
default arguments in options. Use a null string to pass no arguments.
x = rand (1, 10);
y = rand (1, 10);
tri = delaunay (x, y);
triplot (tri, x, y);
hold on;
plot (x, y, "r*");
axis ([0,1,0,1]);
See also: delaunayn, convhull, voronoi, triplot, trimesh, tetramesh, trisurf.
For 3-D inputs delaunay returns a set of tetrahedra that satisfy the
Delaunay circum-circle criteria. Similarly, delaunayn returns the
N-dimensional simplex satisfying the Delaunay circum-circle criteria.
The N-dimensional extension of a triangulation is called a tessellation.
Compute the Delaunay triangulation for an N-dimensional set of points.
The Delaunay triangulation is a tessellation of the convex hull of a set of points such that no N-sphere defined by the N-triangles contains any other points from the set.
The input matrix pts of size [n, dim] contains n points in a space of dimension dim. The return matrix T has size [m, dim+1]. Each row of T contains a set of indices back into the original set of points pts which describes a simplex of dimension dim. For example, a 2-D simplex is a triangle and 3-D simplex is a tetrahedron.
An optional second argument, which must be a string or cell array of strings, contains options passed to the underlying qhull command. See the documentation for the Qhull library for details http://www.qhull.org/html/qh-quick.htm#options. The default options depend on the dimension of the input:
{"Qt", "Qbb", "Qc", "Qz"}
{"Qt", "Qbb", "Qc", "Qx"}
If options is not present or [] then the default arguments are
used. Otherwise, options replaces the default argument list.
To append user options to the defaults it is necessary to repeat the
default arguments in options. Use a null string to pass no arguments.
See also: delaunay, convhulln, voronoin, trimesh, tetramesh.
An example of a Delaunay triangulation of a set of points is
rand ("state", 2);
x = rand (10, 1);
y = rand (10, 1);
T = delaunay (x, y);
X = [ x(T(:,1)); x(T(:,2)); x(T(:,3)); x(T(:,1)) ];
Y = [ y(T(:,1)); y(T(:,2)); y(T(:,3)); y(T(:,1)) ];
axis ([0, 1, 0, 1]);
plot (X, Y, "b", x, y, "r*");
The result of which can be seen in Figure 30.1.
| • Plotting the Triangulation: | ||
| • Identifying Points in Triangulation: |
Next: Voronoi Diagrams, Up: Geometry [Contents][Index]