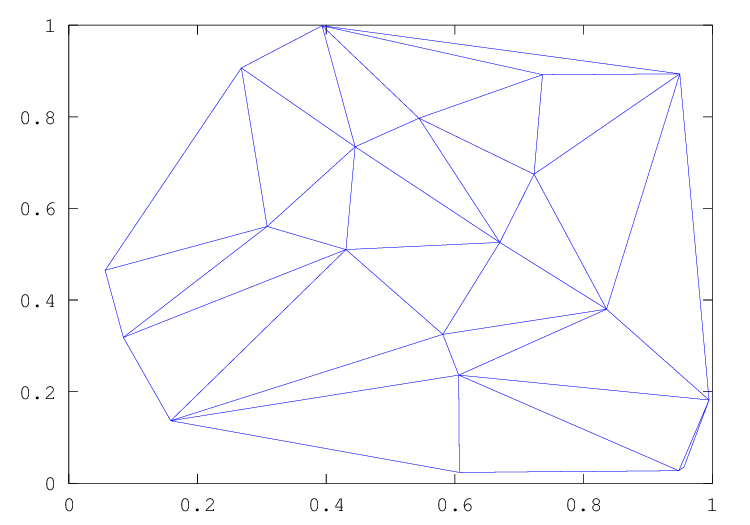
Figure 30.2: Delaunay triangulation of a random set of points
Octave has the functions triplot, trimesh, and trisurf
to plot the Delaunay triangulation of a 2-dimensional set of points.
tetramesh will plot the triangulation of a 3-dimensional set of points.
Plot a 2-D triangular mesh.
tri is typically the output of a Delaunay triangulation over the grid of x, y. Every row of tri represents one triangle and contains three indices into [x, y] which are the vertices of the triangles in the x-y plane.
The linestyle to use for the plot can be defined with the argument
linespec of the same format as the plot command.
The optional return value h is a graphics handle to the created patch object.
Plot a 3-D triangular wireframe mesh.
In contrast to mesh, which plots a mesh using rectangles,
trimesh plots the mesh using triangles.
tri is typically the output of a Delaunay triangulation over the grid of x, y. Every row of tri represents one triangle and contains three indices into [x, y] which are the vertices of the triangles in the x-y plane. z determines the height above the plane of each vertex. If no z input is given then the triangles are plotted as a 2-D figure.
The color of the trimesh is computed by linearly scaling the z values
to fit the range of the current colormap. Use caxis and/or
change the colormap to control the appearance.
Optionally, the color of the mesh can be specified independently of z by supplying a color matrix, c. If z has N elements, then c should be an Nx1 vector for colormap data or an Nx3 matrix for RGB data.
Any property/value pairs are passed directly to the underlying patch object.
The optional return value h is a graphics handle to the created patch object.
See also: mesh, tetramesh, triplot, trisurf, delaunay, patch, hidden.
Plot a 3-D triangular surface.
In contrast to surf, which plots a surface mesh using rectangles,
trisurf plots the mesh using triangles.
tri is typically the output of a Delaunay triangulation over the grid of x, y. Every row of tri represents one triangle and contains three indices into [x, y] which are the vertices of the triangles in the x-y plane. z determines the height above the plane of each vertex.
The color of the trimesh is computed by linearly scaling the z values
to fit the range of the current colormap. Use caxis and/or
change the colormap to control the appearance.
Optionally, the color of the mesh can be specified independently of z by supplying a color matrix, c. If z has N elements, then c should be an Nx1 vector for colormap data or an Nx3 matrix for RGB data.
Any property/value pairs are passed directly to the underlying patch object.
The optional return value h is a graphics handle to the created patch object.
Display the tetrahedrons defined in the m-by-4 matrix T as 3-D patches.
T is typically the output of a Delaunay triangulation of a 3-D set of points. Every row of T contains four indices into the n-by-3 matrix X of the vertices of a tetrahedron. Every row in X represents one point in 3-D space.
The vector C specifies the color of each tetrahedron as an index into the current colormap. The default value is 1:m where m is the number of tetrahedrons; the indices are scaled to map to the full range of the colormap. If there are more tetrahedrons than colors in the colormap then the values in C are cyclically repeated.
Calling tetramesh (…, "property", "value", …) passes all
property/value pairs directly to the patch function as additional arguments.
The optional return value h is a vector of patch handles where each
handle represents one tetrahedron in the order given by T.
A typical use case for h is to turn the respective patch
"visible" property "on" or "off".
Type demo tetramesh to see examples on using tetramesh.
The difference between triplot, and trimesh or triplot,
is that the former only plots the 2-dimensional triangulation itself, whereas
the second two plot the value of a function f (x, y). An
example of the use of the triplot function is
rand ("state", 2)
x = rand (20, 1);
y = rand (20, 1);
tri = delaunay (x, y);
triplot (tri, x, y);
which plots the Delaunay triangulation of a set of random points in 2-dimensions. The output of the above can be seen in Figure 30.2.